E2B Code Sandbox MCP
E2B MCP provides isolated Python execution environments. Your AI can run actual code instead of just describing what code might do.
The real value emerges when you combine secure remote execution with Jan's flexible model selection. You can use local models for conversation and reasoning while offloading actual computation to E2B's sandboxes. This means you get the privacy and control of local models plus the computational power of cloud infrastructure, without the complexity of managing Python environments or dependencies locally.
Setup
Prerequisites
- Jan with MCP enabled
- E2B API key from e2b.dev (opens in a new tab)
- Node.js installed
- Model with tool calling support
Configuration
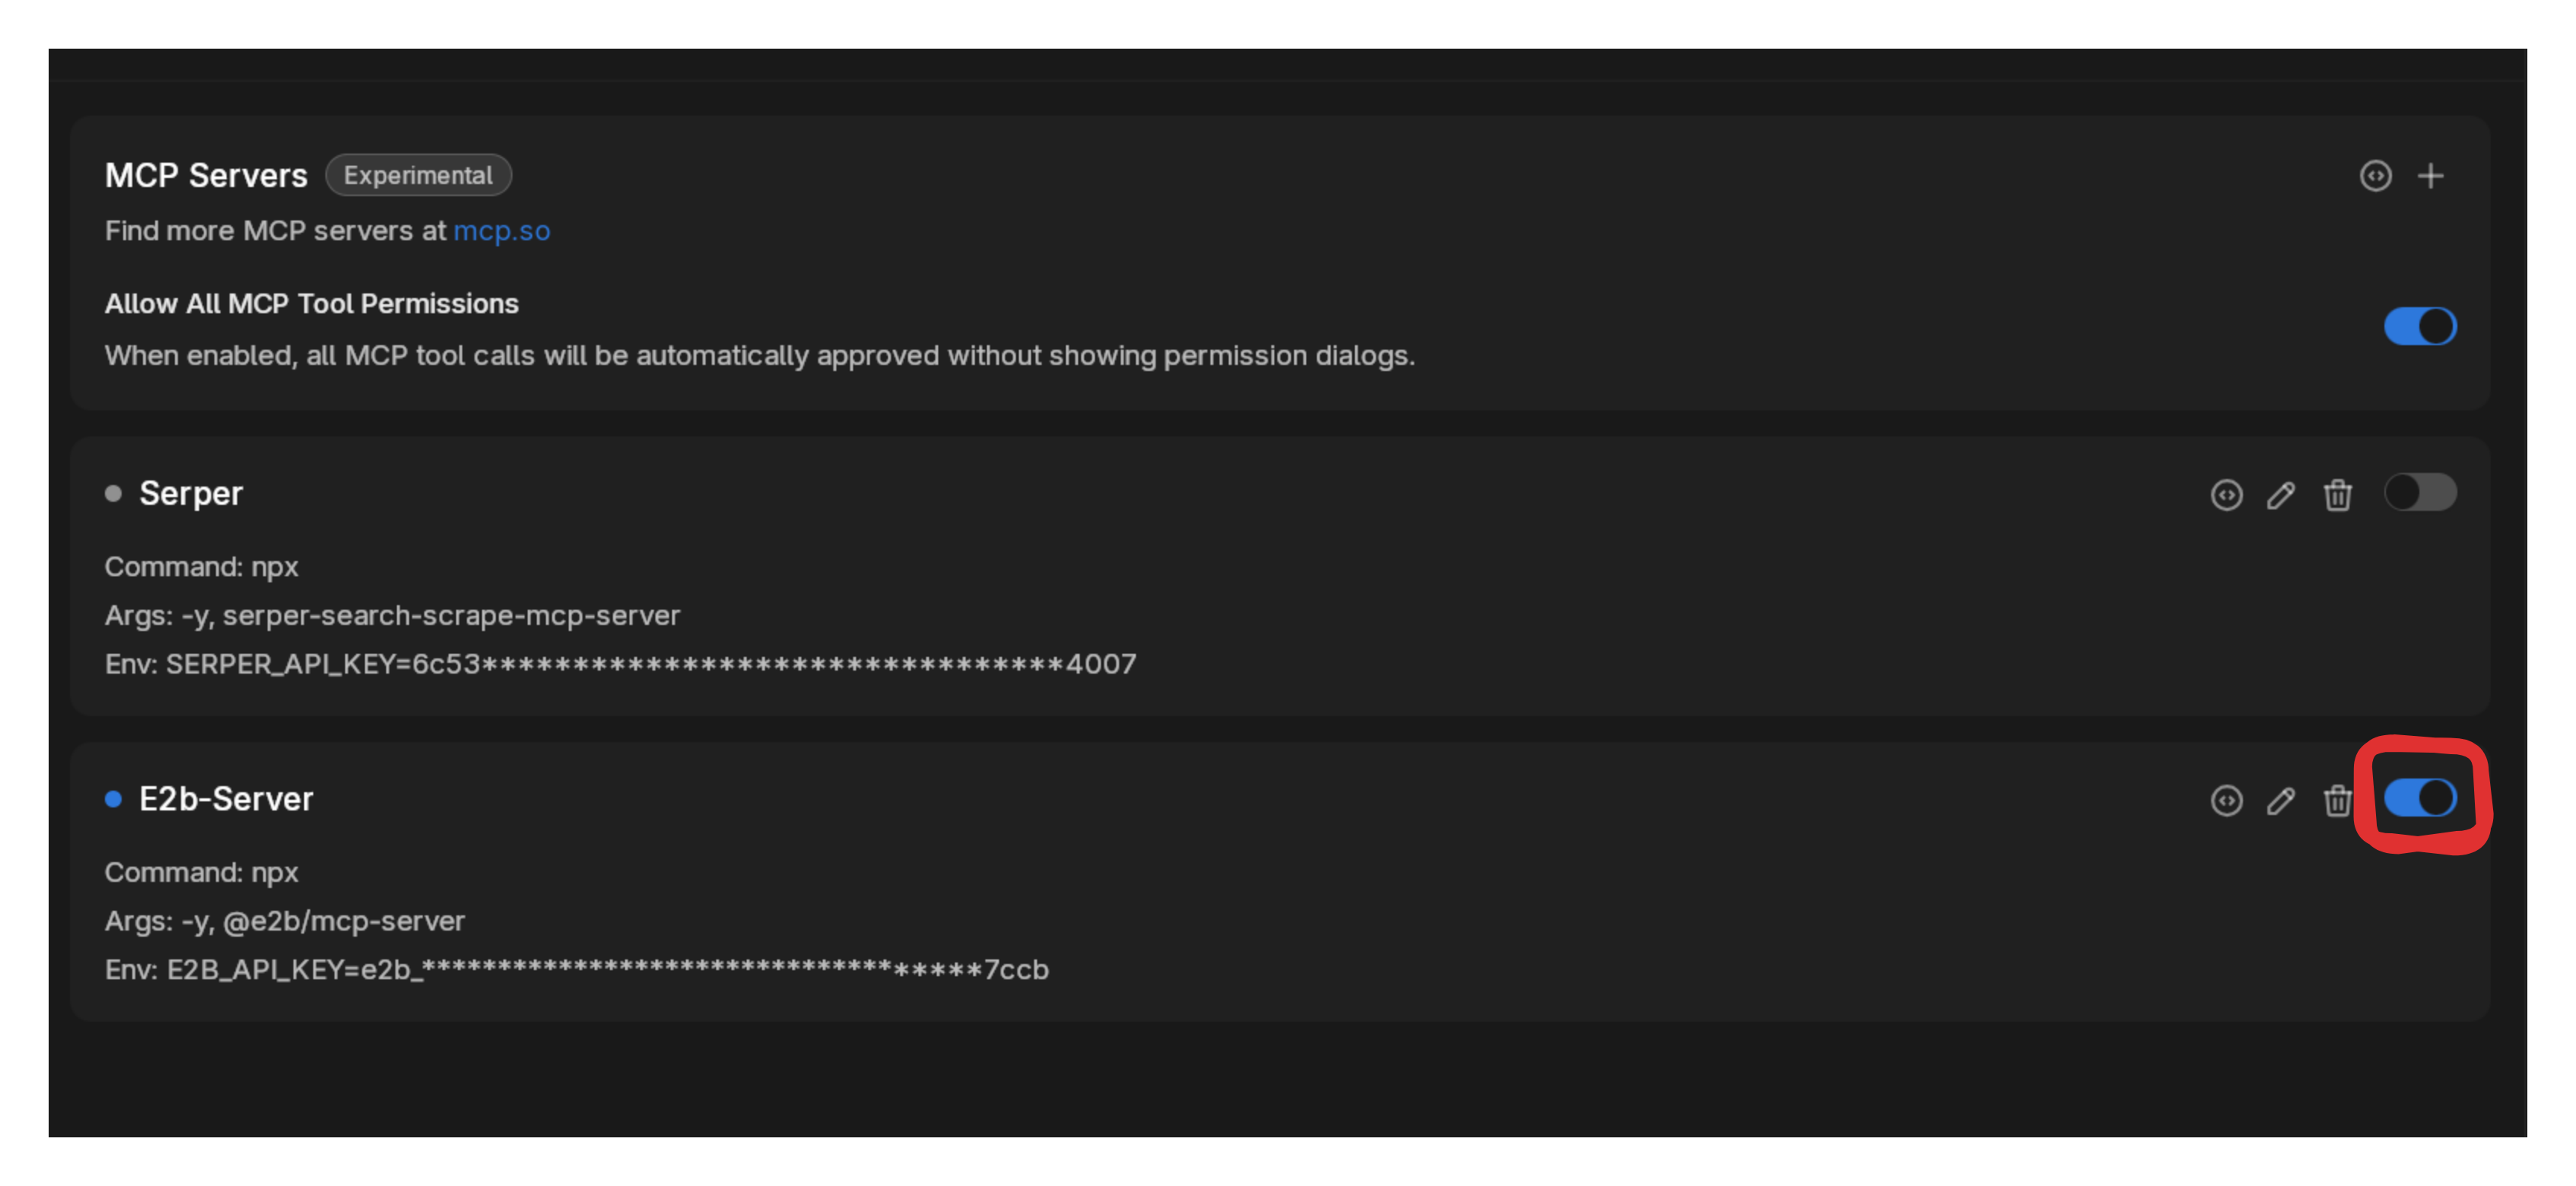
- Enable MCP: Go to Settings > MCP Servers, toggle Allow All MCP Tool Permission ON
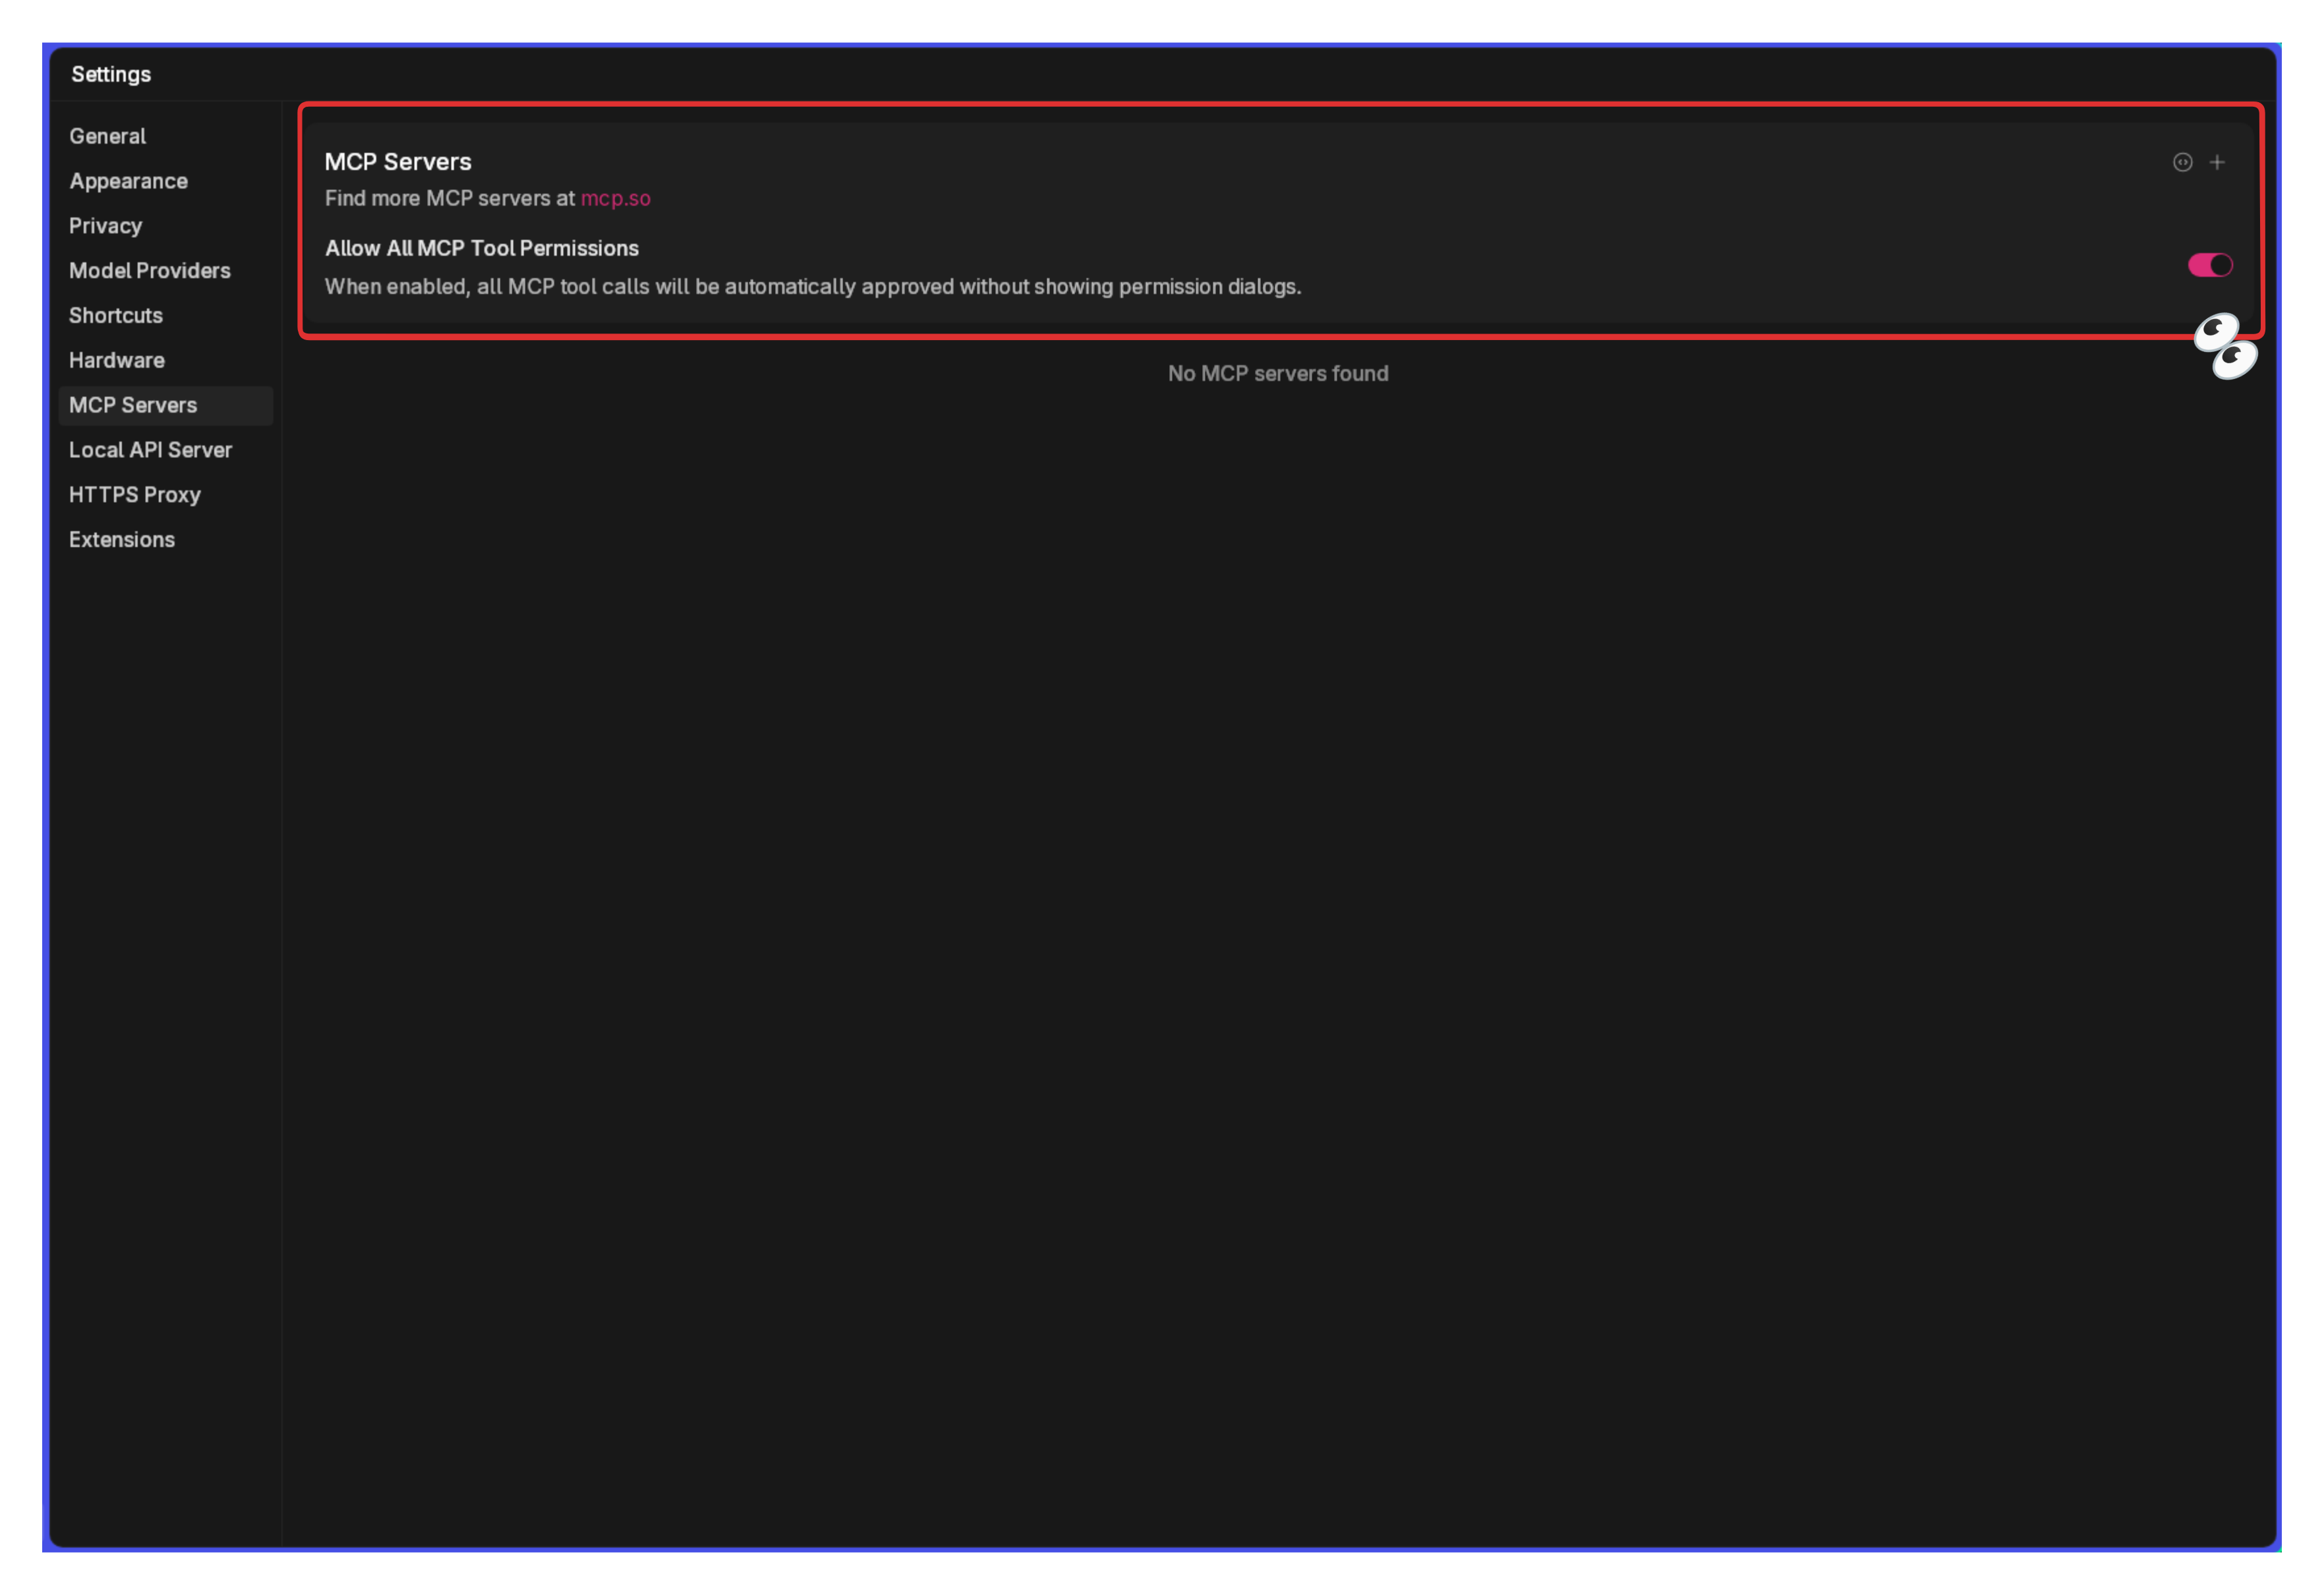
Don't forget that MCP gets enabled once you turn on Experimental Features in Jan's General settings.
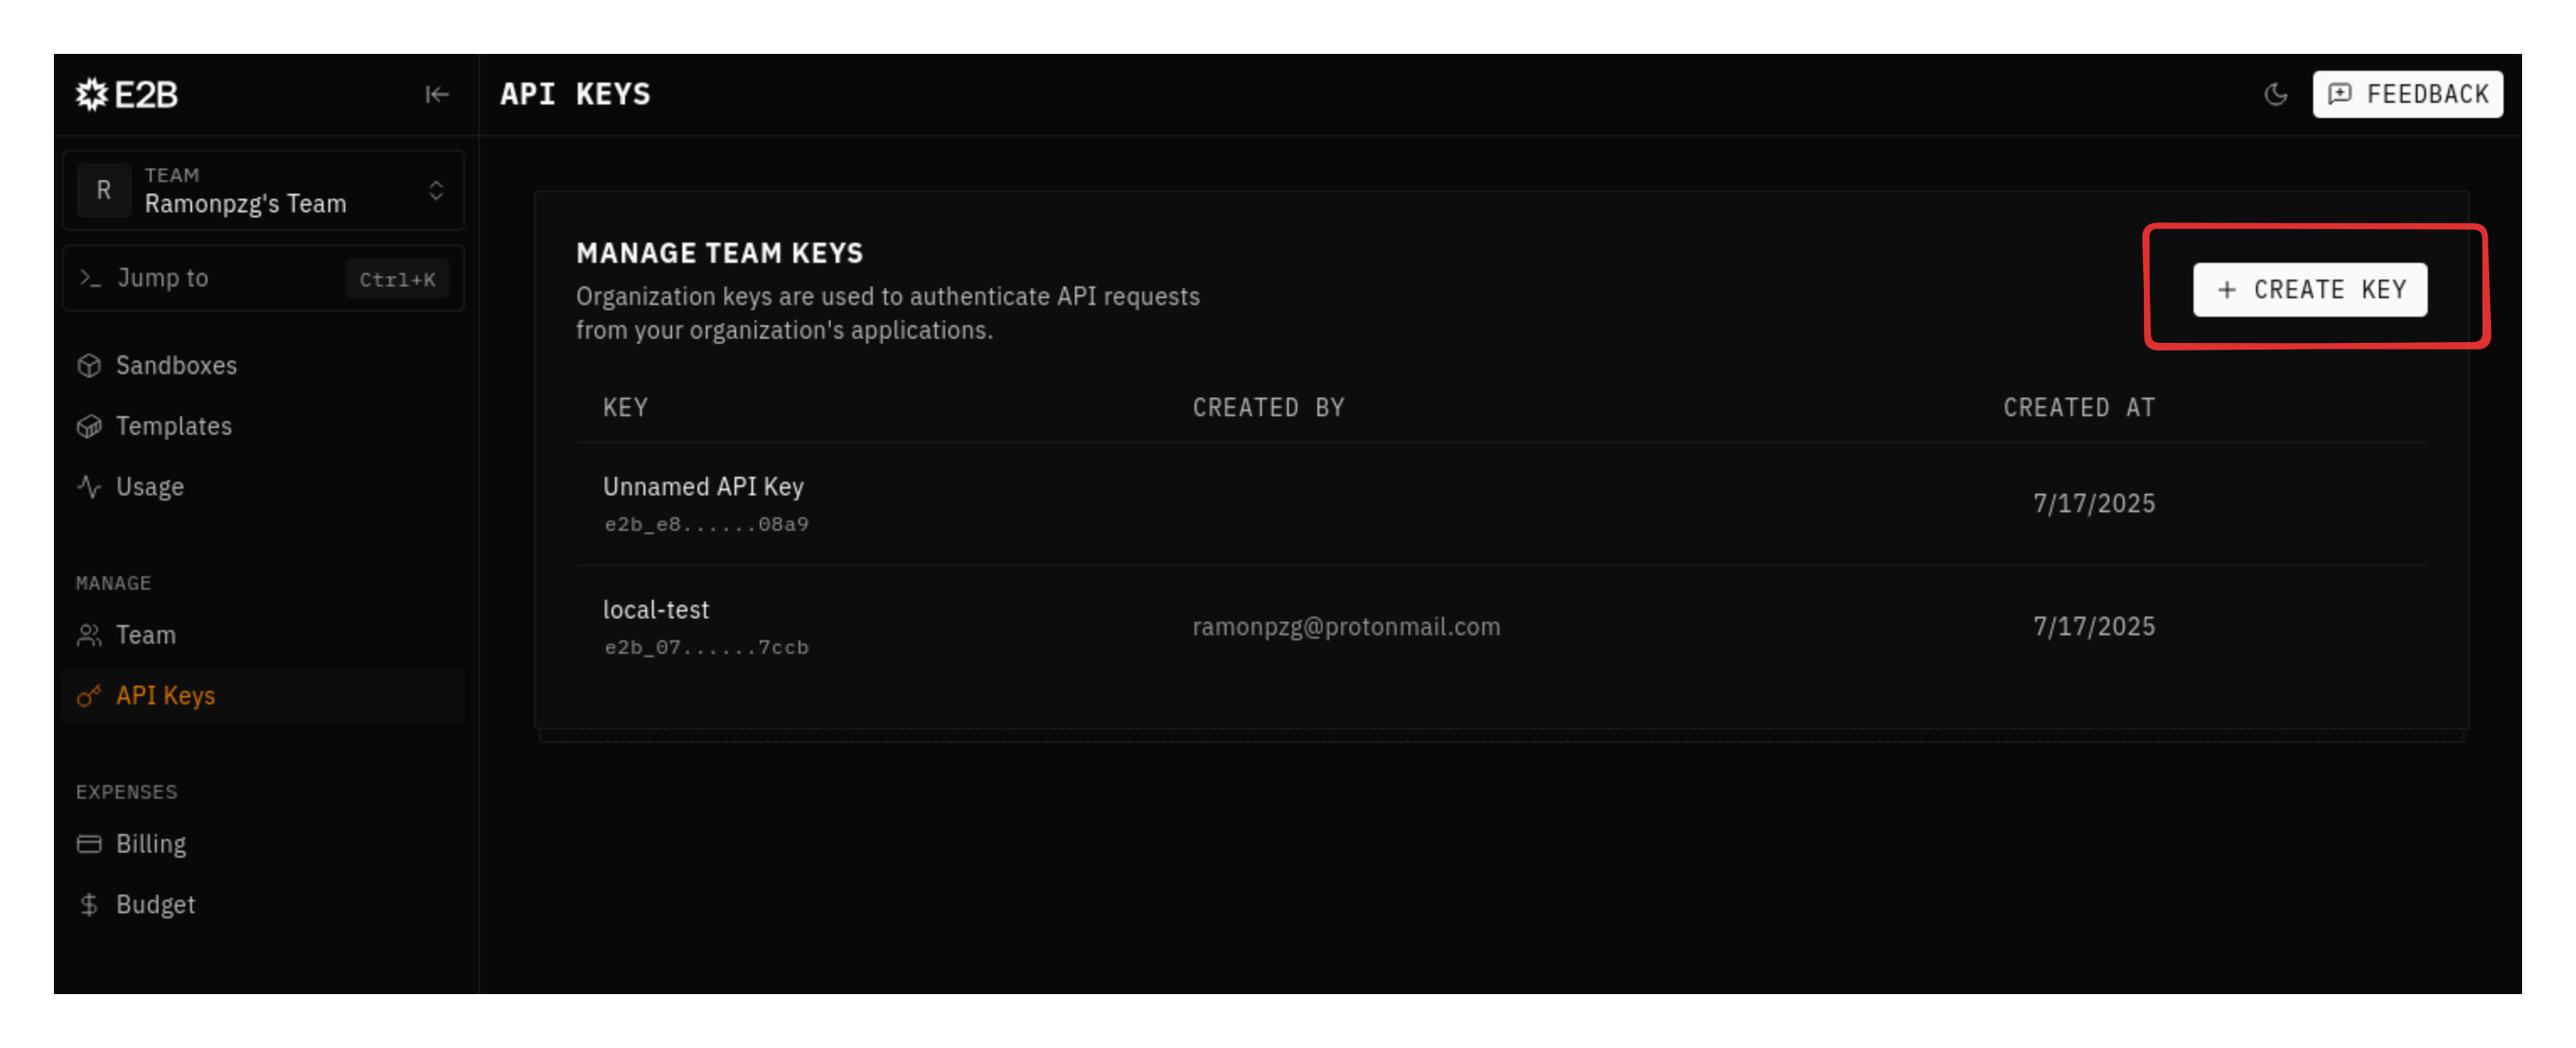
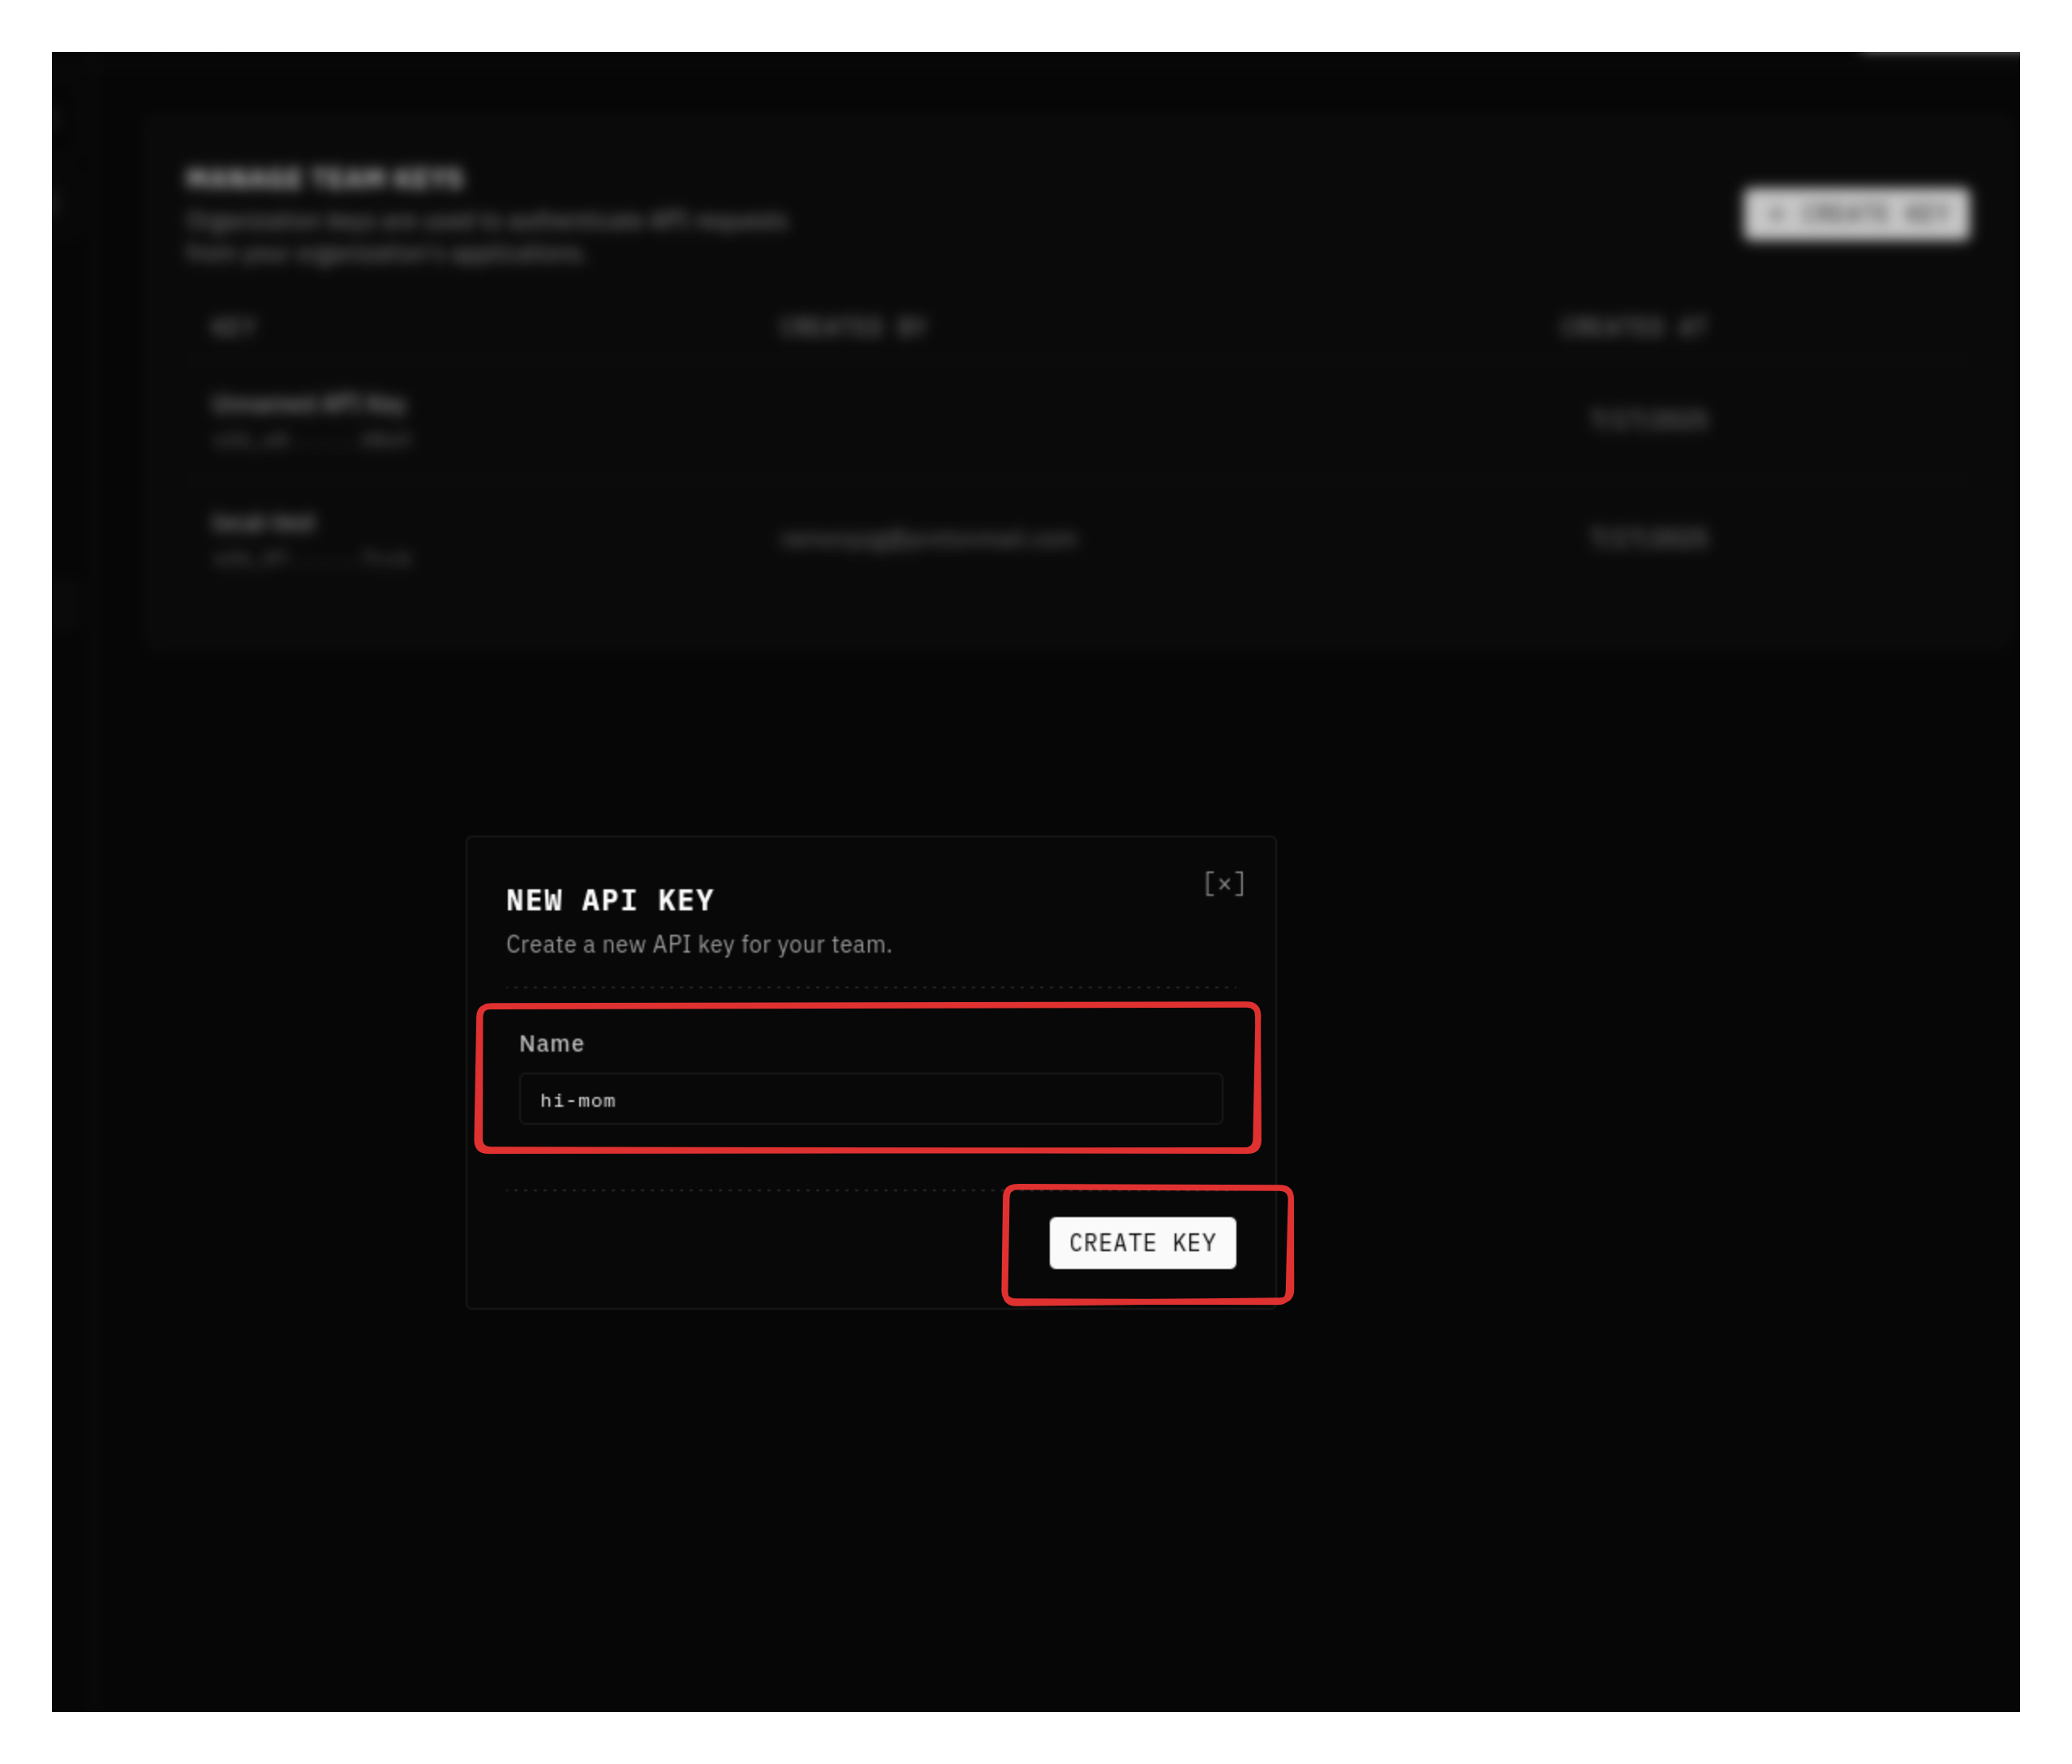
- Get API Key: Sign up at e2b.dev (opens in a new tab), generate an API key
Add a meaningful name to your key.
- Add MCP Server: Click
+in MCP Servers section
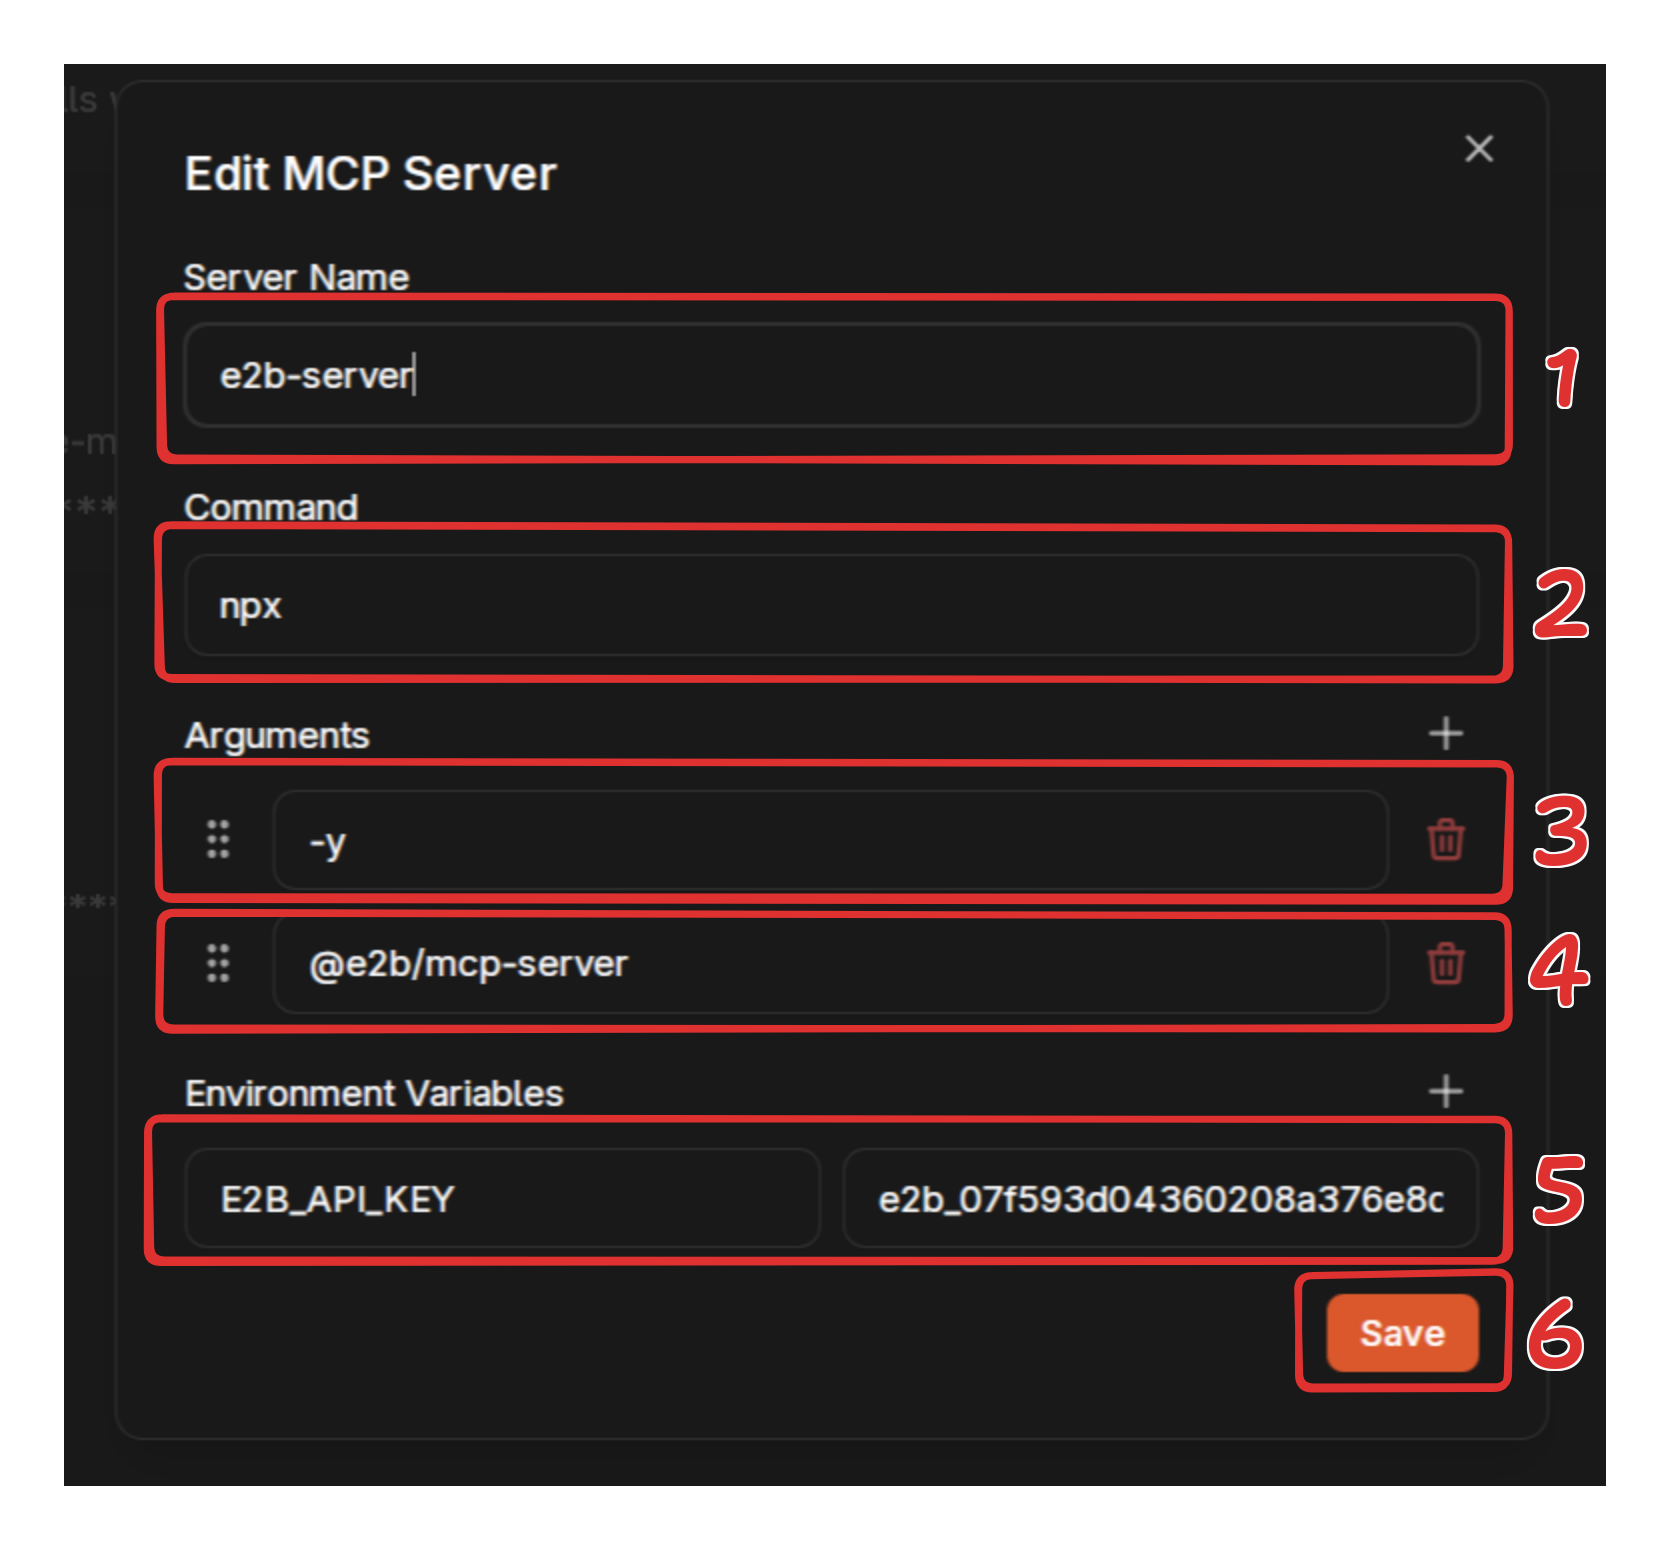
Configure:
- Server Name:
e2b-server - Command:
npx - Arguments:
@e2b/mcp-server - Environment Variables:
- Key:
E2B_API_KEY - Value:
your-api-key
- Key:
- Verify: Check server shows as active
Pre-installed Libraries
The sandbox includes these packages by default:
Data Analysis & Science:
pandas(1.5.3) - Data manipulationnumpy(1.26.4) - Numerical computingscipy(1.12.0) - Scientific computingscikit-learn(1.4.1) - Machine learningsympy(1.12) - Symbolic mathematics
Visualization:
matplotlib(3.8.3) - Static plotsseaborn(0.13.2) - Statistical visualizationplotly(5.19.0) - Interactive chartsbokeh(3.3.4) - Web-ready visualizations
Data Processing:
requests(2.26.0) - HTTP requestsbeautifulsoup4(4.12.3) - HTML/XML parsingopenpyxl(3.1.2) - Excel filespython-docx(1.1.0) - Word documents
Text & NLP:
nltk(3.8.1) - Natural language processingspacy(3.7.4) - Advanced NLPtextblob(0.18.0) - Text processinggensim(4.3.2) - Topic modeling
Image & Audio:
opencv-python(4.9.0) - Computer visionscikit-image(0.22.0) - Image processingimageio(2.34.0) - Image I/Olibrosa(0.10.1) - Audio analysis
Additional packages can be installed as needed.
Examples
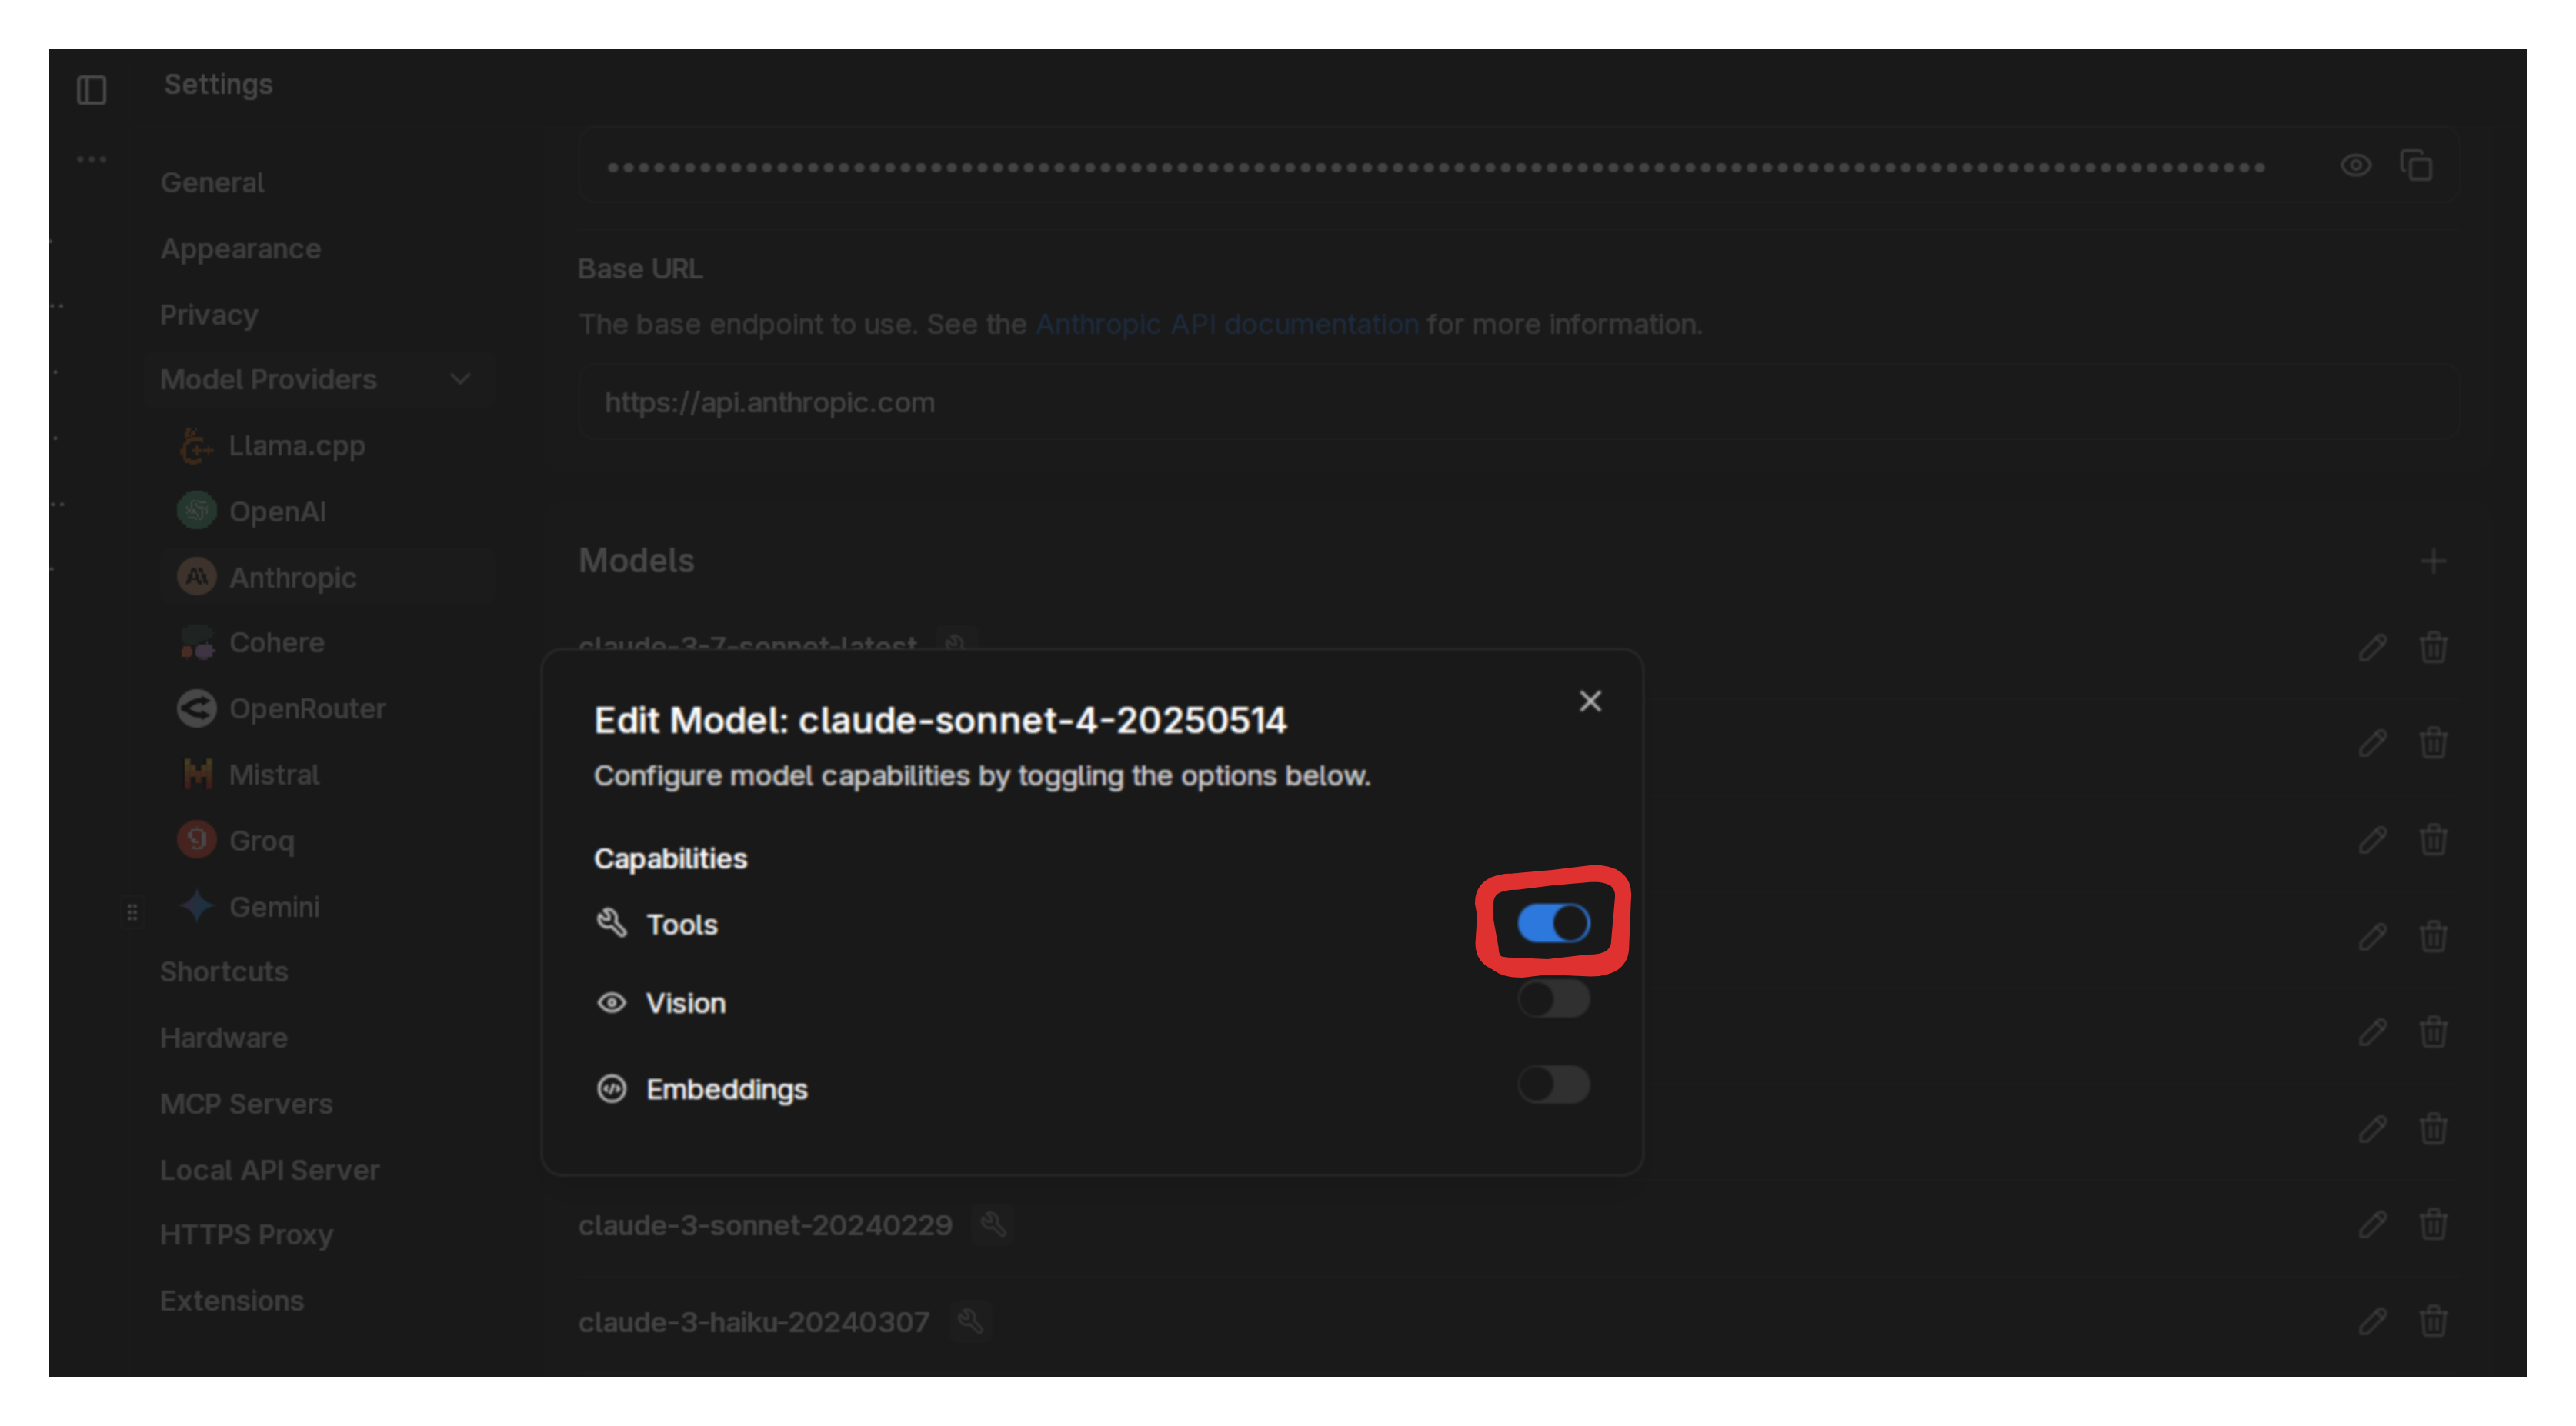
For the following examples, we'll use Claude 4 Sonnet but you can use any local or remote model with tool calling capabilities you'd like.
Make sure you activate Tools on the model you're using.
Basic Data Analysis
Start small. Open a new chat, confirm that the model has tools enabled and ask it to create a small dataset of 100 students with grades and study hours.
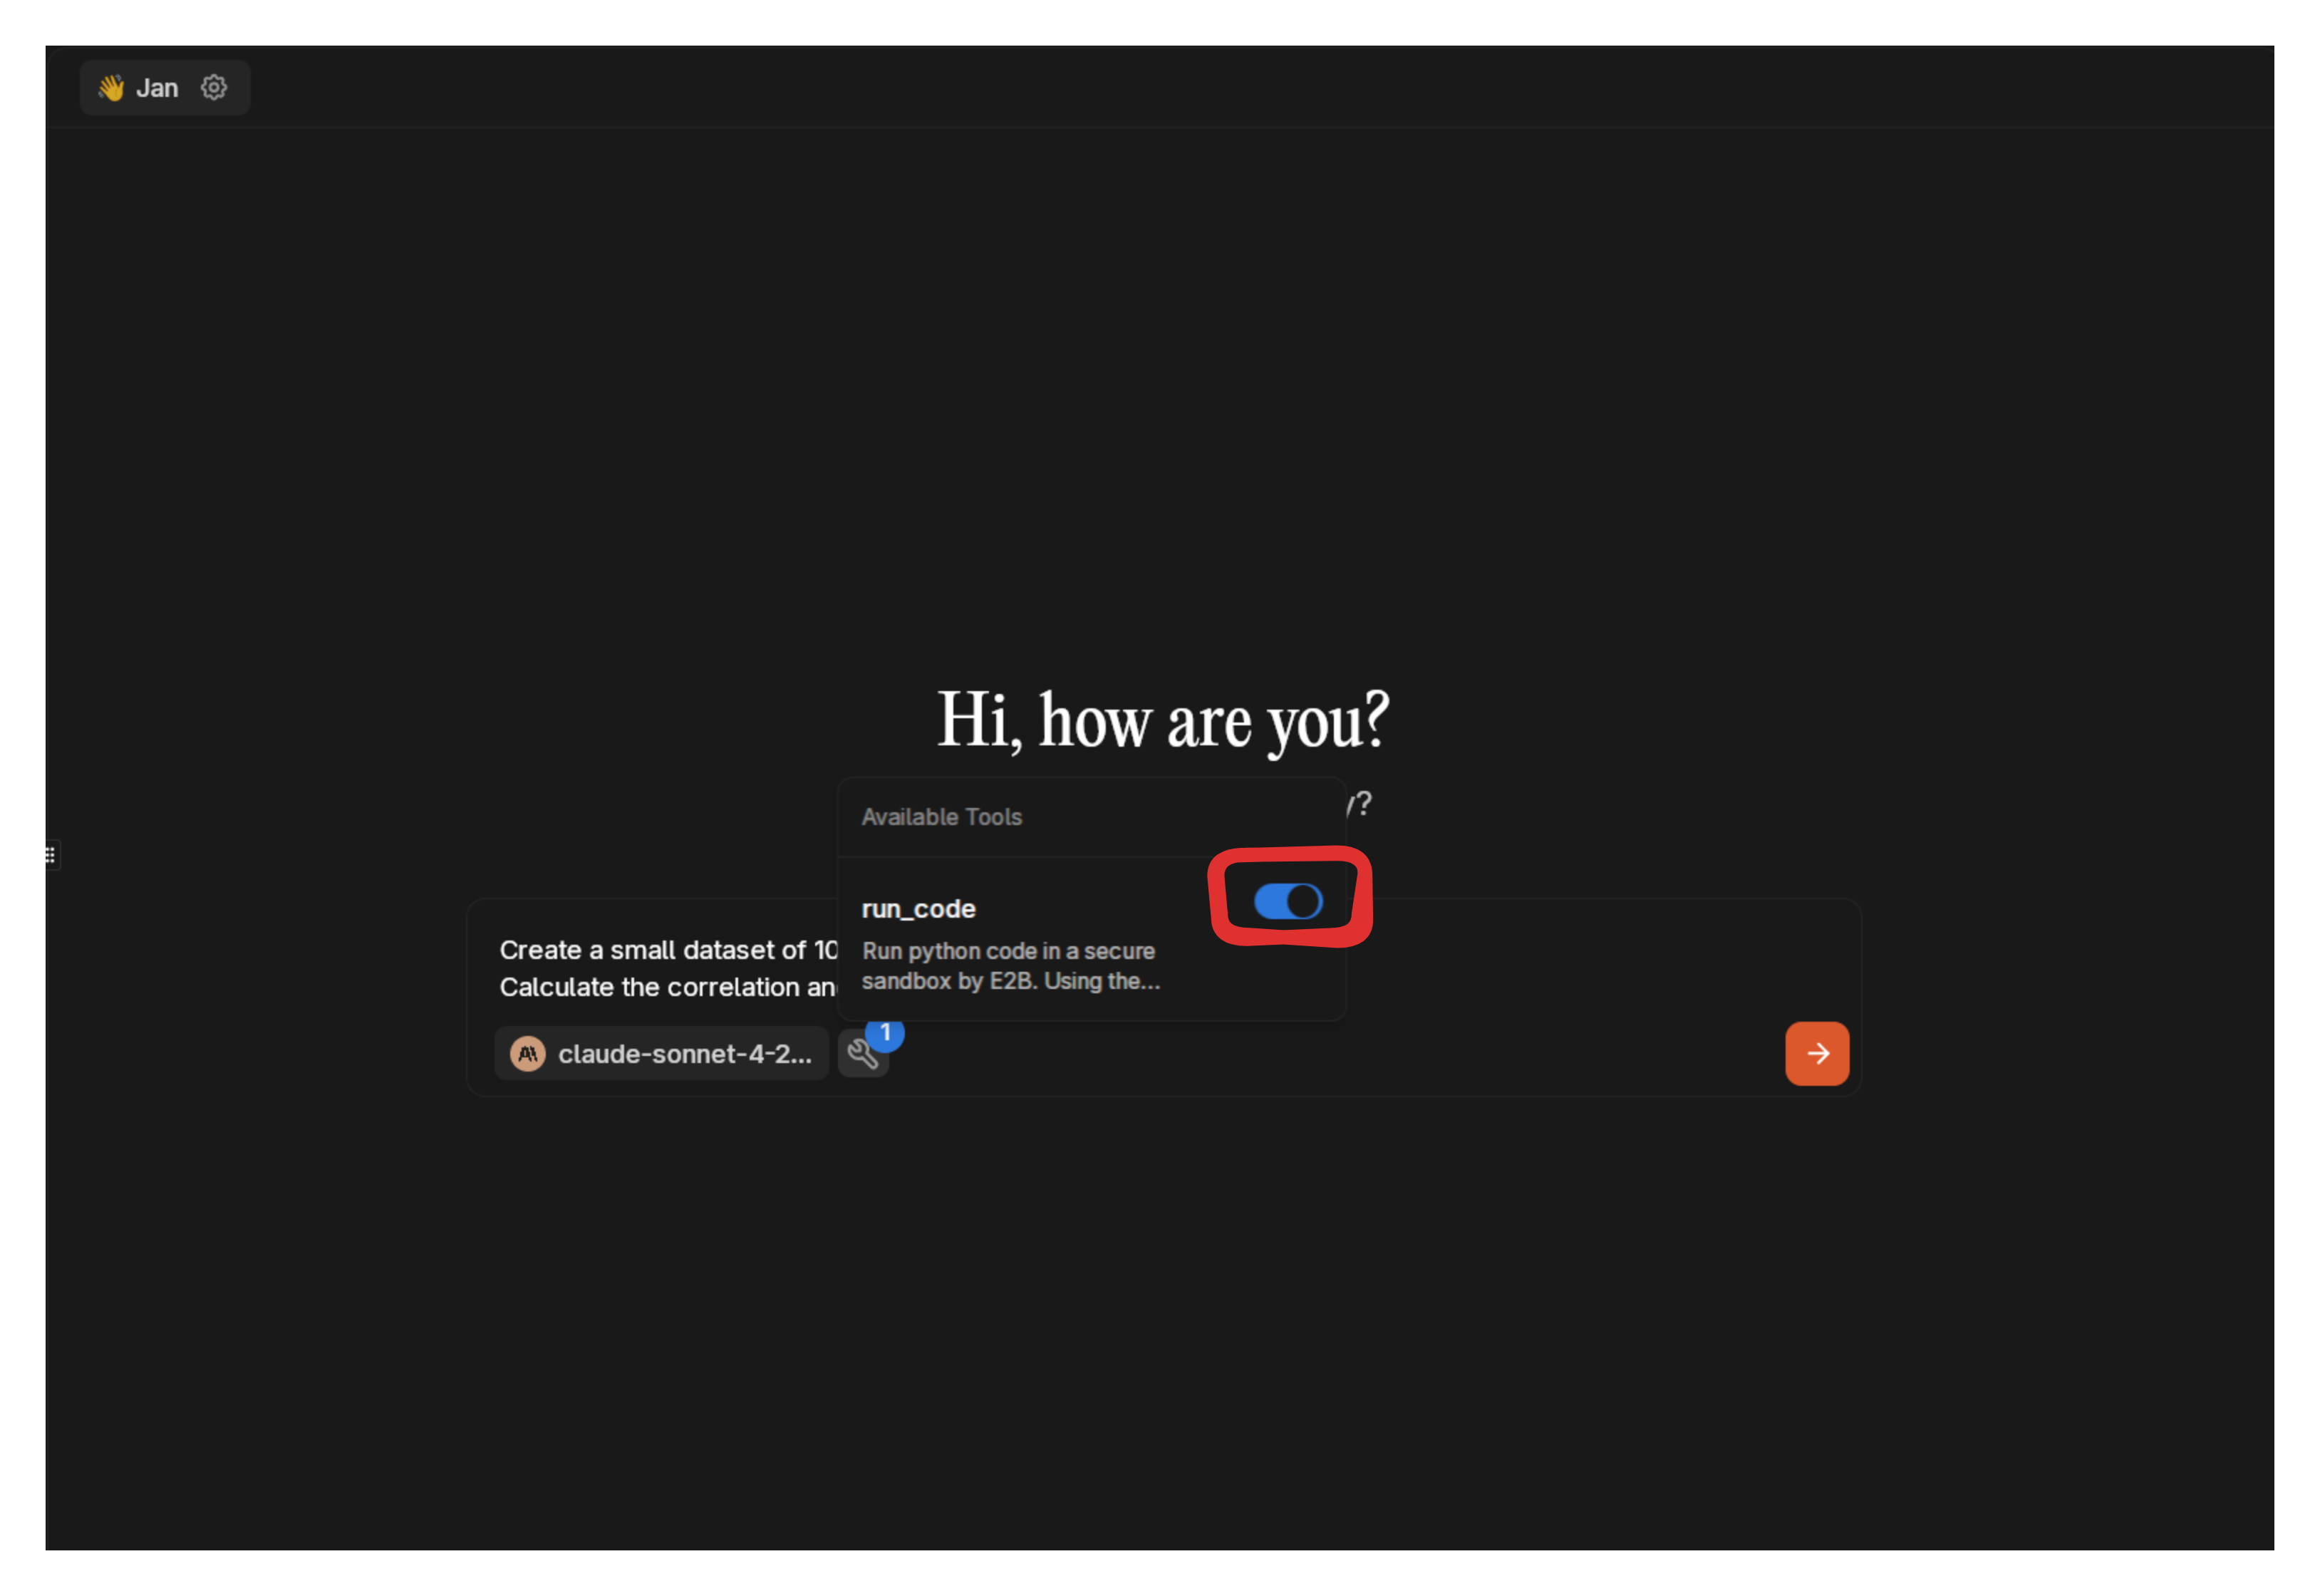
Create a small dataset of 100 students with grades and study hours. Calculate the correlation and create a scatter plot.
The model will:
- Generate data with pandas (100 rows)
- Calculate correlation coefficient
- Create a matplotlib scatter plot
- Add trend line
As of v0.6.5, Jan won't be able to display visualizations in the chat but we're to get this fixed for the next release.
Statistical Computing
Run a Monte Carlo simulation with 10,000 iterations to estimate π.
Expected output:
- Numerical computation with numpy
- Convergence plot showing estimate improvement
- Final π estimate
For more intensive simulations, increase iterations gradually and monitor performance.
Machine Learning
Create a simple 2-class dataset with 200 samples. Train a logistic regression model and visualize the decision boundary.
The model will:
- Generate synthetic 2D classification data
- Train a single scikit-learn model
- Plot data points and decision boundary
Time Series Analysis
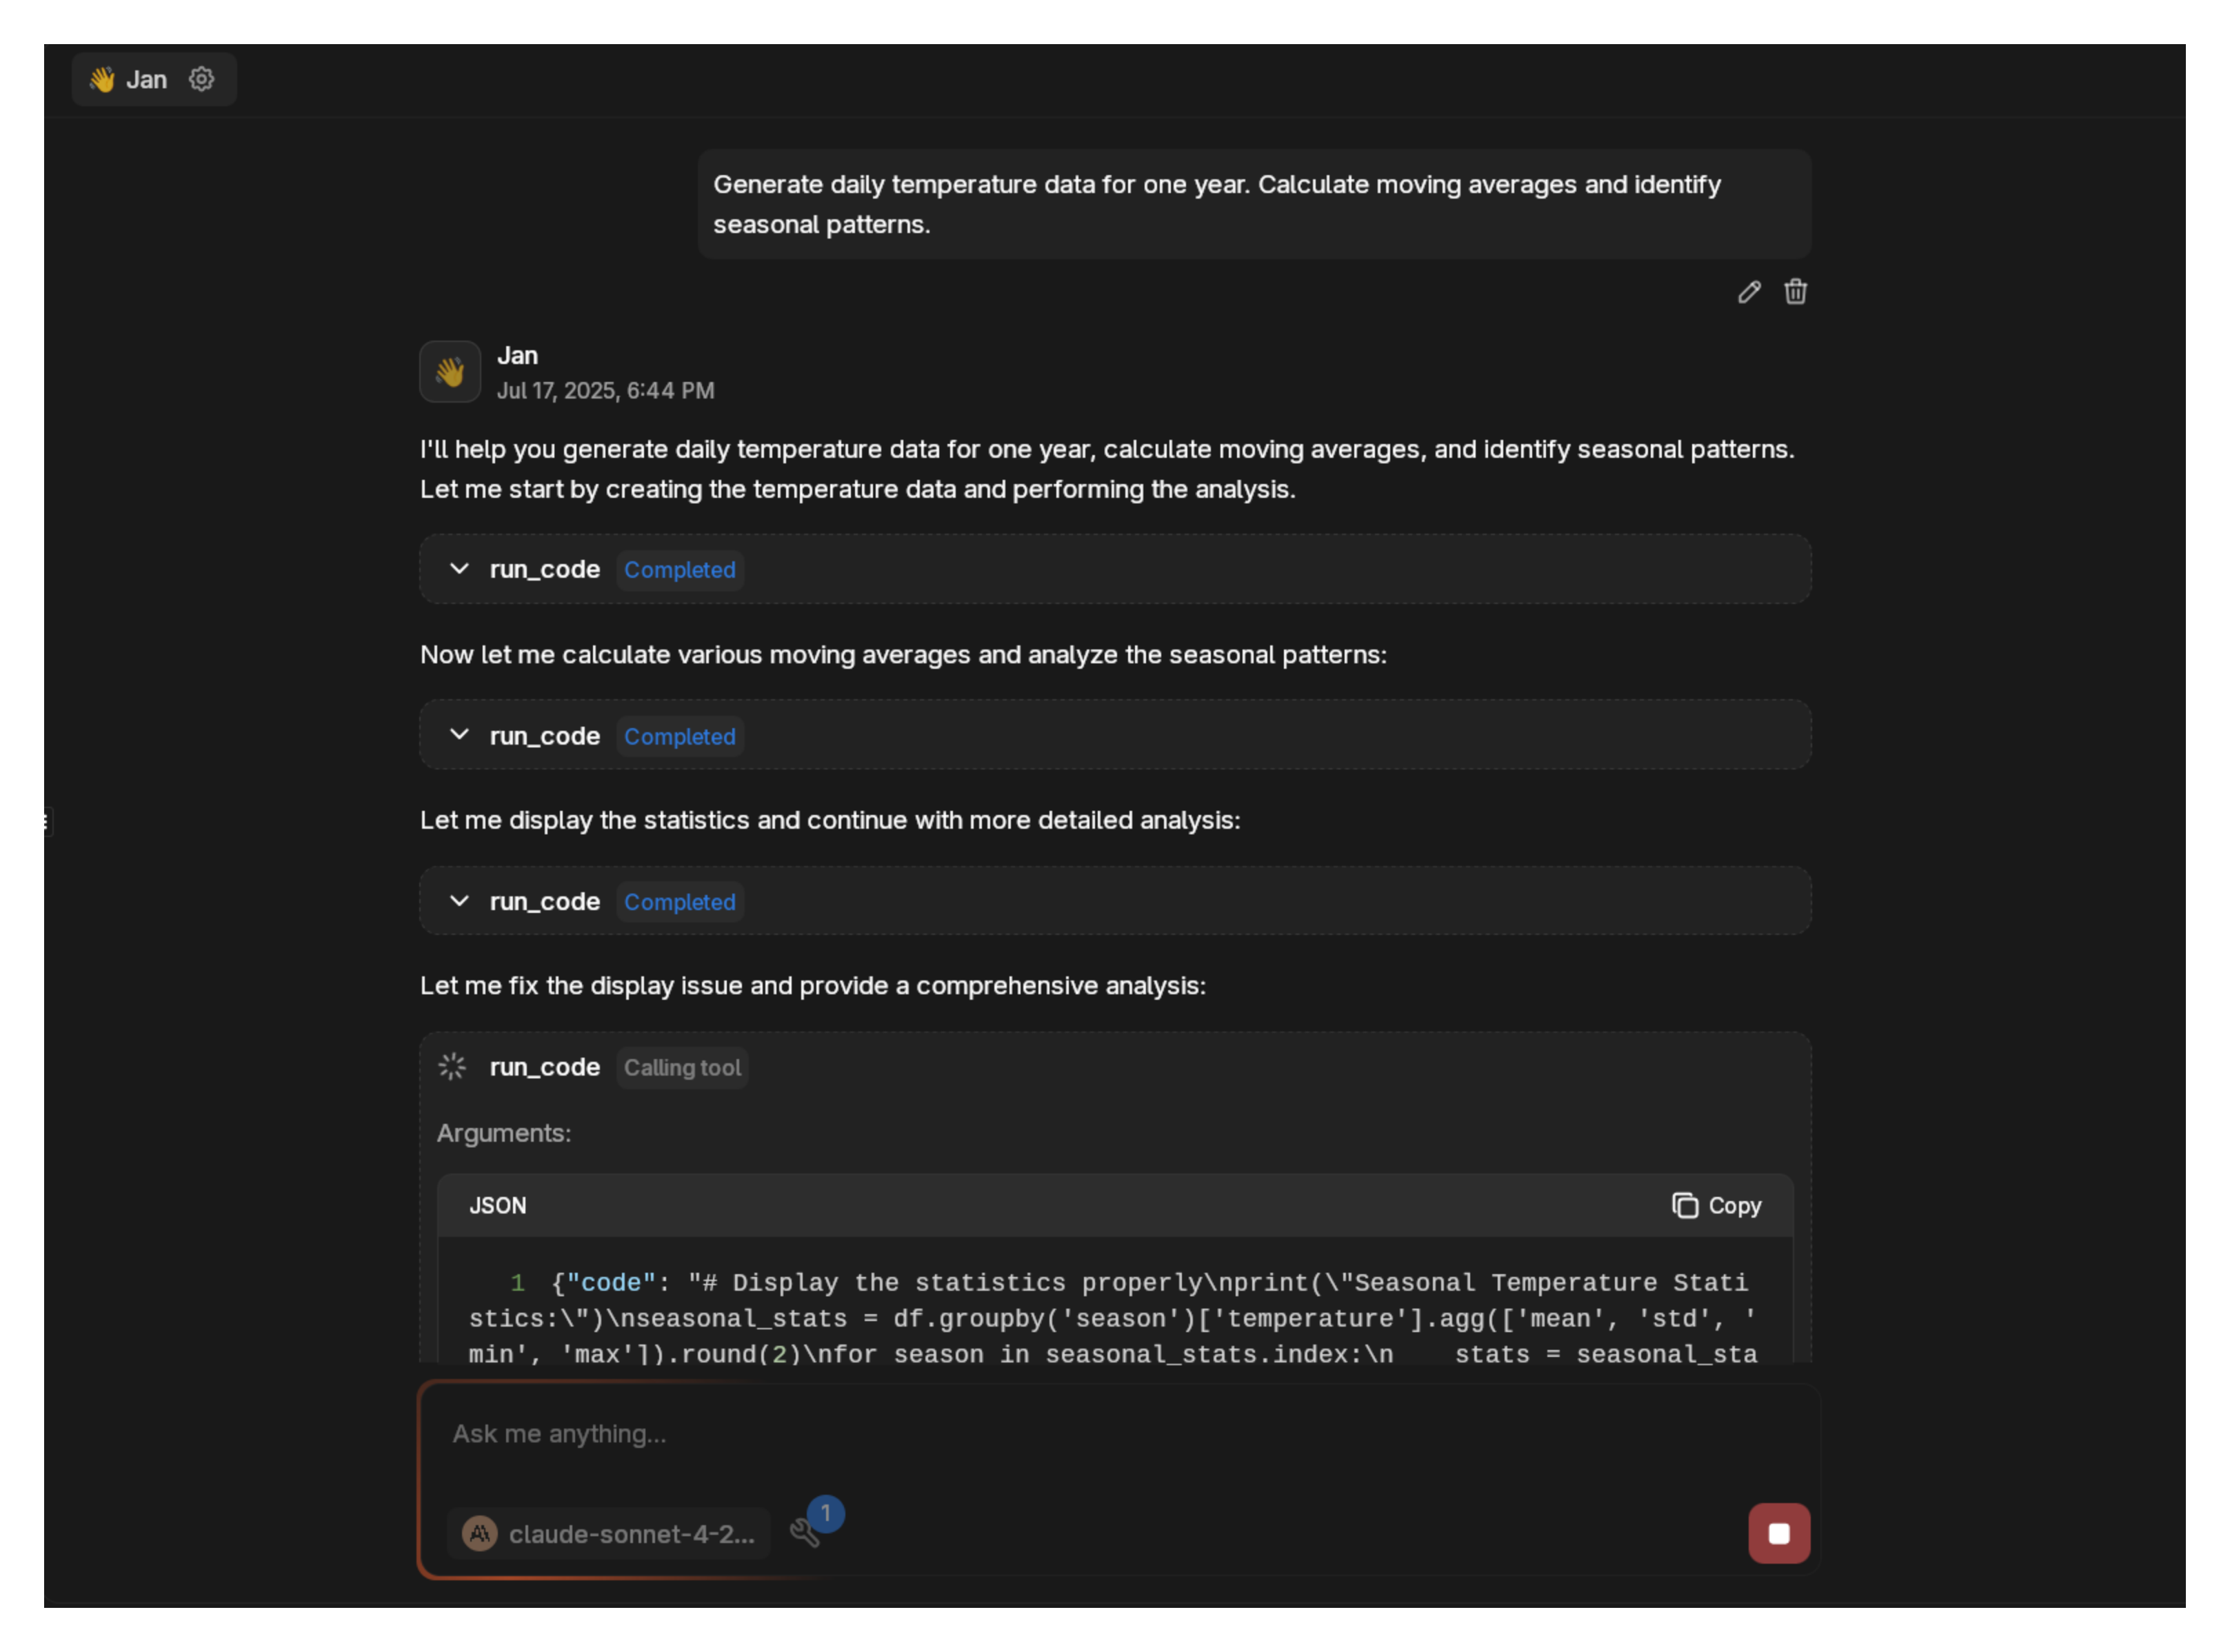
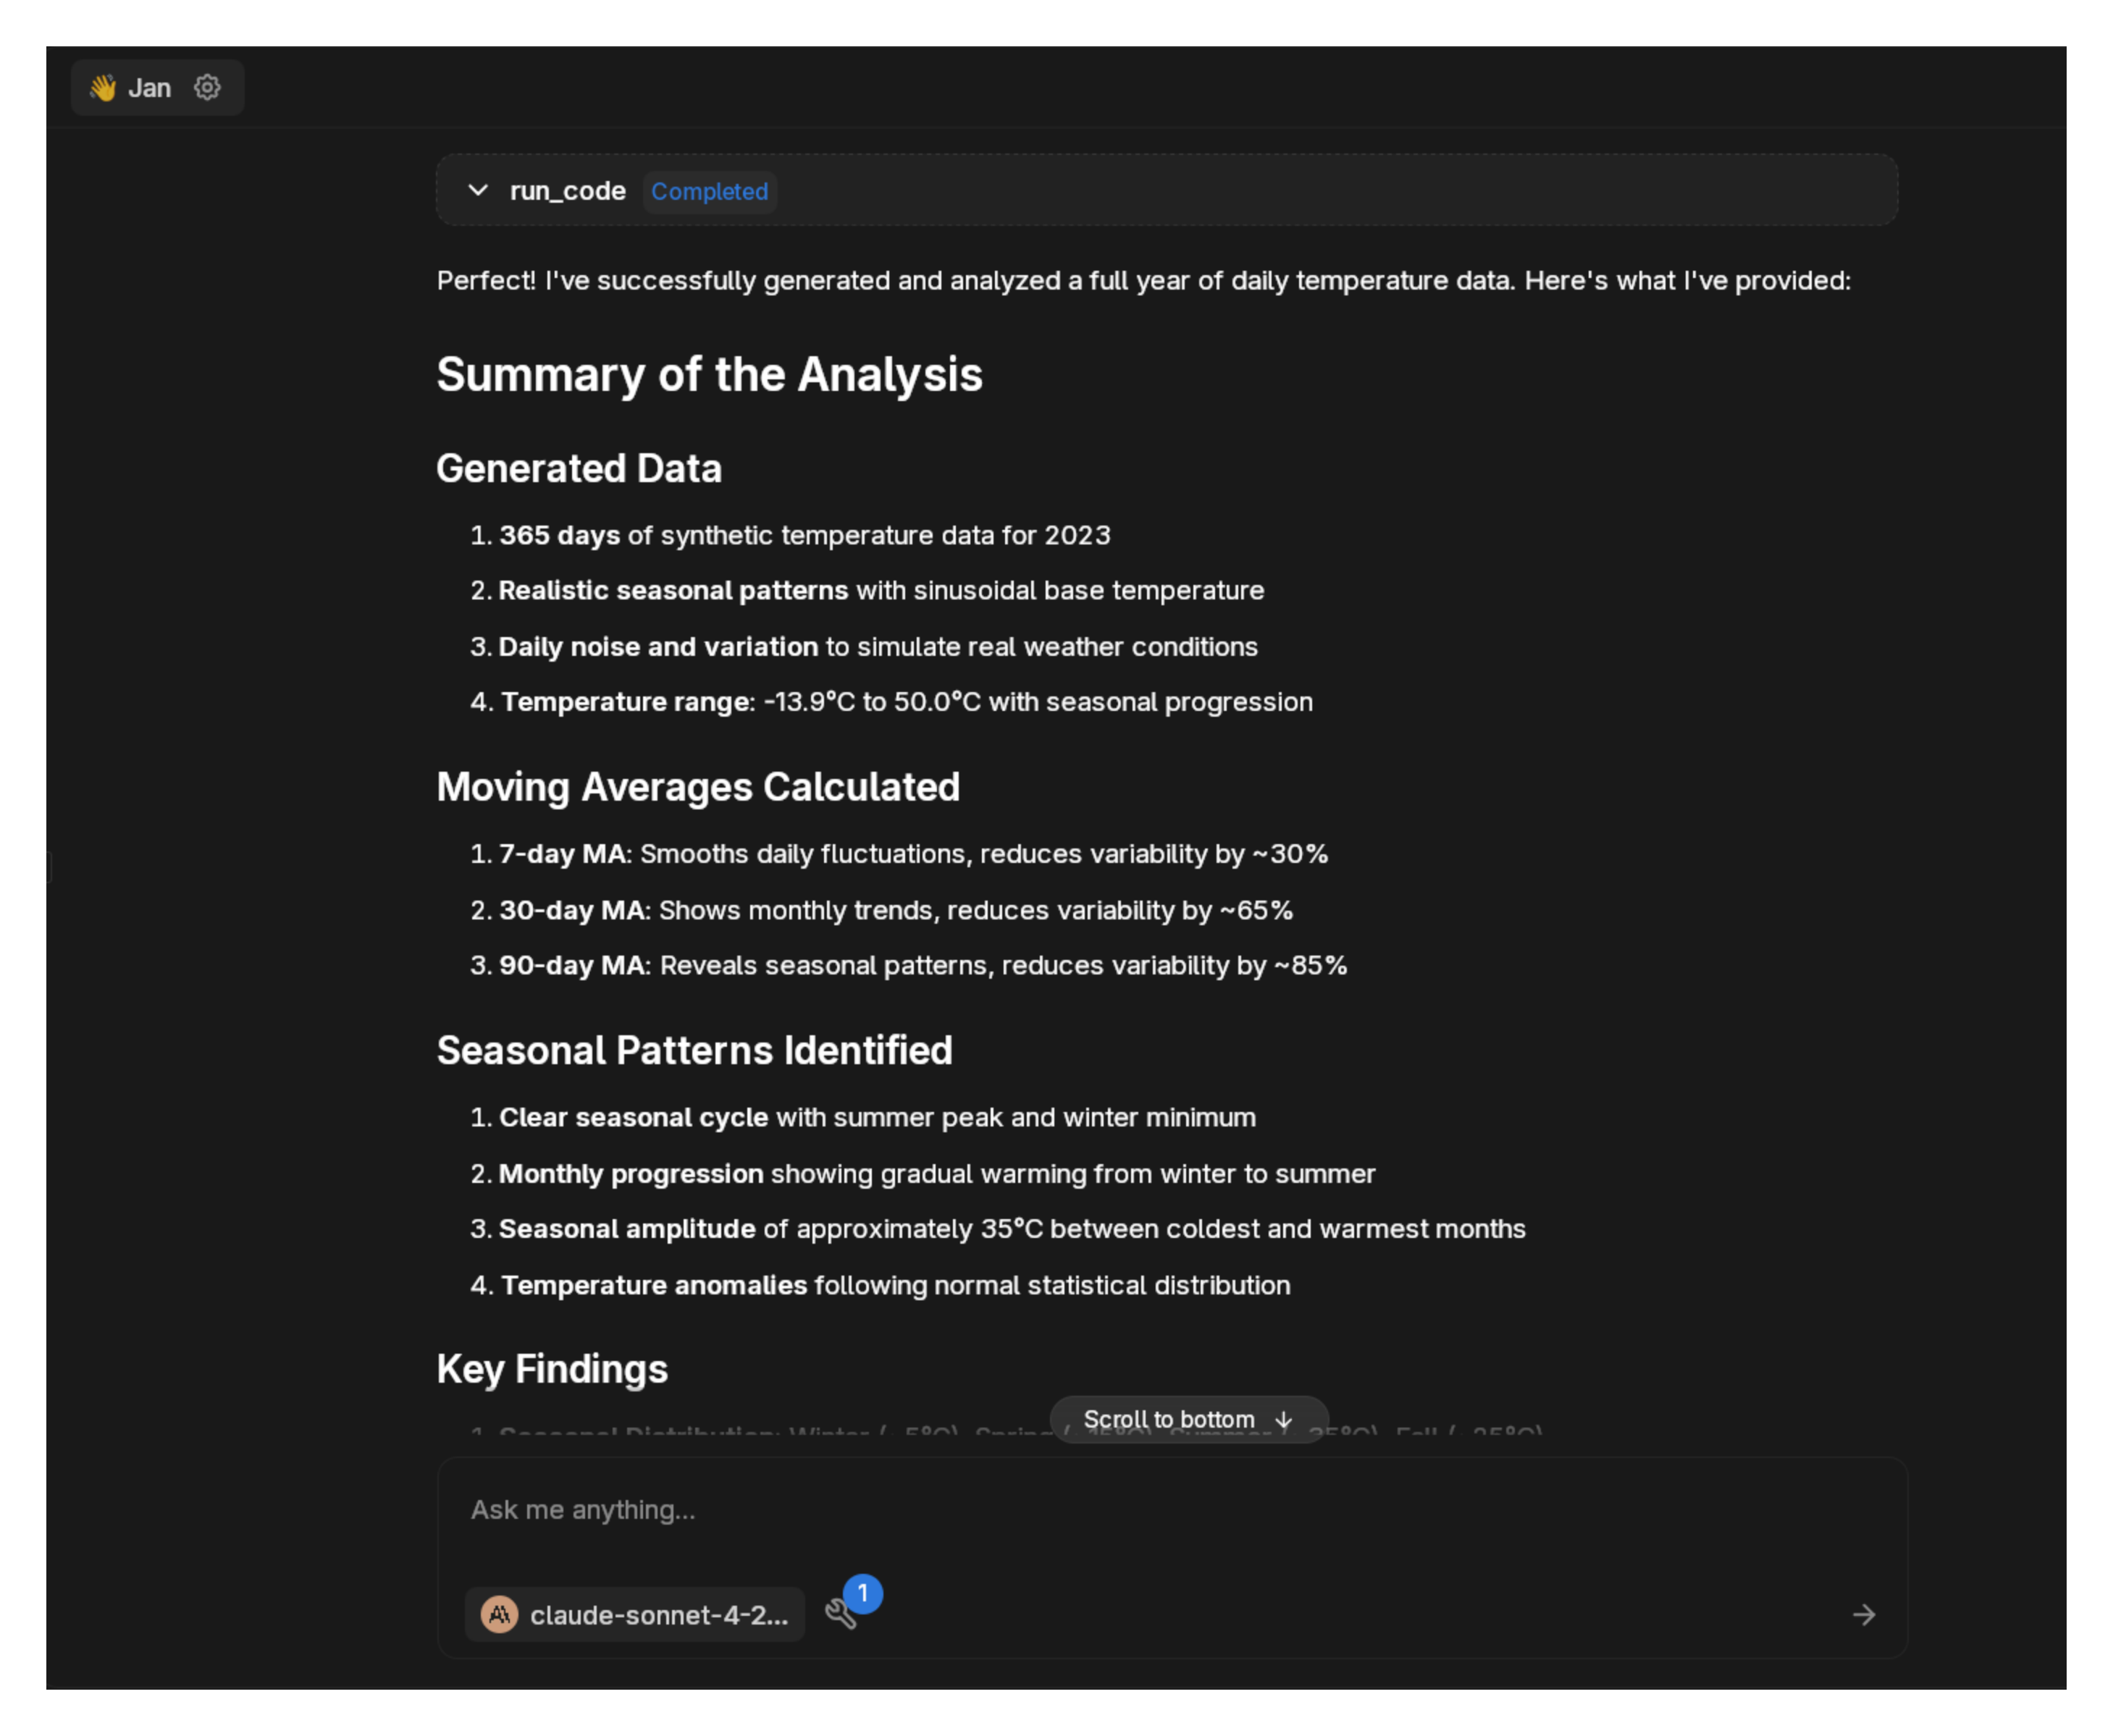
Generate daily temperature data for one year. Calculate moving averages and identify seasonal patterns.
Output includes:
- Line plot of temperature data
- Moving average overlay
- Simple seasonal decomposition
Scaling Up
Once basic examples work, you can increase complexity:
- Larger datasets (1000+ samples)
- Multiple models for comparison
- Complex visualizations with subplots
- Advanced statistical tests
The sandbox handles moderate computational loads well. For very large datasets or intensive ML training, consider breaking work into smaller chunks.
Chart Generation
E2B automatically detects and extracts charts from matplotlib code. Charts are returned as base64-encoded images and downloadable files.
Static Charts
import matplotlib.pyplot as pltimport numpy as npx = np.linspace(0, 10, 100)y = np.sin(x)plt.figure(figsize=(10, 6))plt.plot(x, y)plt.title('Sine Wave')plt.xlabel('x')plt.ylabel('sin(x)')plt.show()
E2B captures the plot and makes it available for download.
Interactive Charts
The system extracts chart data for frontend visualization:
plt.bar(['A', 'B', 'C'], [10, 20, 15])plt.title('Sample Bar Chart')plt.show()
Returns structured data:
{ "type": "bar", "title": "Sample Bar Chart", "elements": [ {"label": "A", "value": 10}, {"label": "B", "value": 20}, {"label": "C", "value": 15} ]}
Supported chart types: line, bar, scatter, pie, box plots.
Available Tools
- run_code: Execute Python code
- install_package: Add Python packages
- create_file: Save files to sandbox
- read_file: Access sandbox files
- list_files: Browse sandbox contents
Troubleshooting
Connection Issues:
- Verify API key is correct
- Check Node.js installation
- Restart Jan if server won't start
Execution Problems:
- Free sandboxes have 2 cores and 1GB RAM - start with small datasets
- Large computations may time out or run out of memory
- Scale up complexity gradually after testing basic examples
- Some packages may require explicit installation
Package Installation:
- Most data science packages install successfully
- System dependencies may cause failures for some packages
- Try alternative packages if installation fails
E2B has computational and memory limits. Break large operations into smaller chunks if needed.
Use Cases
E2B is useful for:
- Academic Research: Statistical analysis, data visualization, hypothesis testing
- Data Science: Exploratory data analysis, model prototyping, result validation
- Financial Analysis: Portfolio optimization, risk calculations, market simulations
- Scientific Computing: Numerical simulations, mathematical modeling, algorithm testing
- Prototyping: Quick algorithm validation, proof-of-concept development
The sandbox provides isolated execution without local environment setup or dependency management.